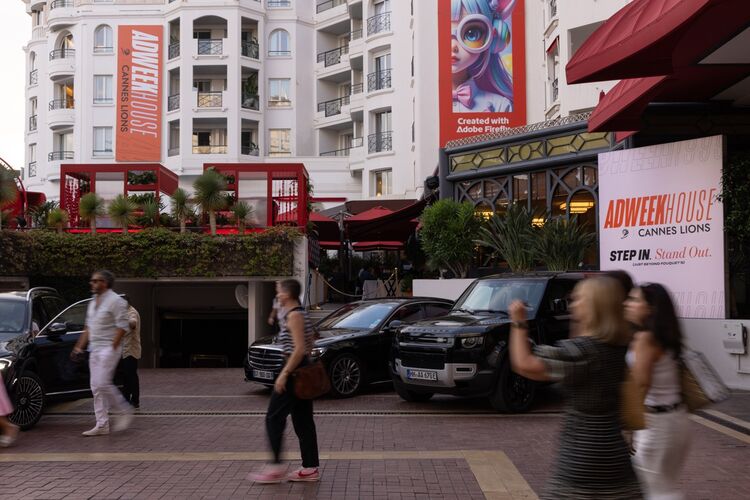
ADWEEK House at Cannes Lions
The recap tracked signups, message activity, and gallery engagement.

See how guests engaged with your event. Track signups, gallery activity, photo downloads, messages, and audience estimates in one dashboard.
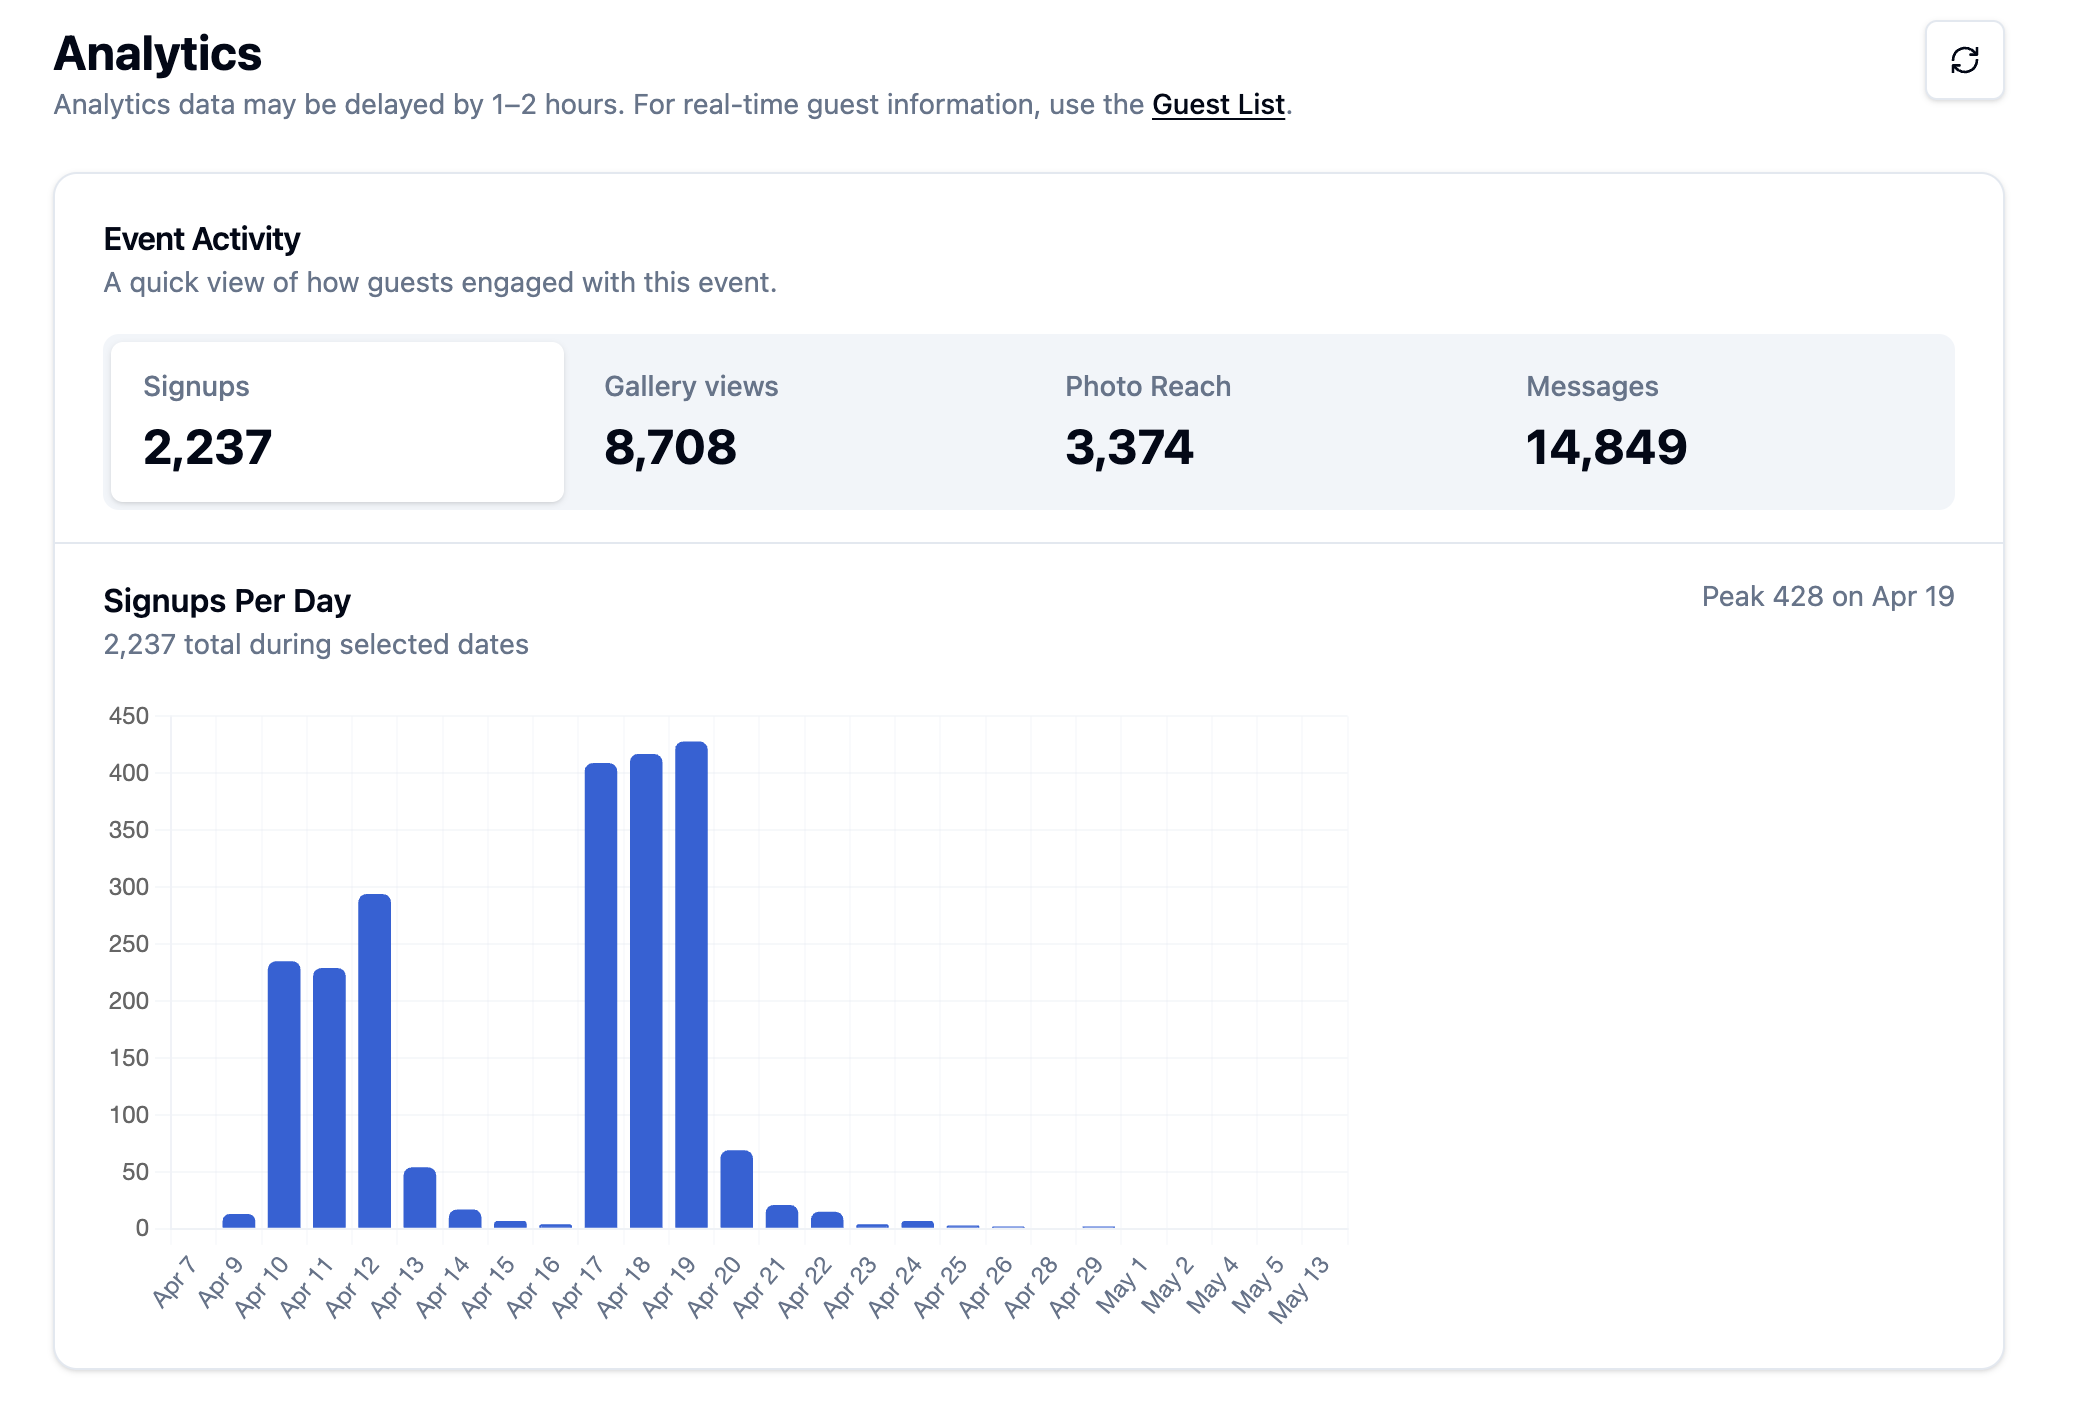
See daily signups, signup sources, and how QR or link visits turn into completed registrations.
Review gallery views, photo clicks and downloads, messages, guest replies, and opt-outs.
Explore estimated age and gender breakdowns alongside the top states from guest ZIP codes.
The recap tracked signups, message activity, and gallery engagement.

The retreat recap included downloads and photo engagement.
Analytics data may be delayed by 1–2 hours. Use the Guest List for real-time guest information.
Signups, signup sources and conversion, gallery views, image clicks, downloads, photo delivery, messages, replies, and opt-outs.
Age and gender breakdowns are estimated from guest selfies. Guests without a usable selfie are excluded. State breakdowns use guest ZIP codes.
No. Gallery views, image clicks, and downloaded photos are separate metrics. The dashboard also shows how image clicks turn into downloads.