
FREE EVENT MARKETING TEMPLATE
Free Post-Event Report Template
Show your boss or client how many guests came, when attendance peaked and what your event achieved. Start with a free post-event report template, a completed example and a KPI worksheet.
Editable PowerPoint + Excel · Works with Google Slides and Sheets
A clear recap. A useful next step.
What’s In Your Event Report Kit?
Use the presentation for your stakeholder recap and the worksheet to calculate the metrics behind it. Replace the example with your event results.
Editable Report Deck
Seven report sections, prompts for your results and space for event photos. Make it your own in PowerPoint or Google Slides.
Download PowerPoint templateAttendance Dashboard & KPI Worksheet
Chart guests per day or arrivals per hour. See peak attendance, progress against your goal and event ROI.
Download Excel worksheetCompleted Example
See how the numbers become a story, from 1,000 attendees to the follow-up plan. Includes filled attendance and KPI examples.
Download example reportWhat Should A Post-Event Report Include?
Start with the goal and the outcome. Then show the data, the moments that mattered and what your team should do next.
This event recap template works for brand activations, conferences and trade shows. Keep the sections that help your audience make a decision.
- 1
Executive Recap
Connect your event objective to the headline outcome.
- 2
Audience And Contacts
Report attendance, opted-in contacts and qualified leads.
- 3
Photos And Engagement
Pair event highlights with photo delivery and download metrics.
- 4
Attendee Feedback
Summarize survey responses and the feedback worth acting on.
- 5
Follow-Up And Pipeline
Show lead progress, closed revenue and open opportunities separately.
- 6
Event Costs And ROI
Compare attributable revenue with total event costs.
- 7
Next Event
Turn the results into actions, with an owner and timing for each.
Show Guests Per Day Or Hour
Give your team a clear view of attendance. Chart guests across a multi-day event or arrivals throughout a single day.
Both Excel and Google Sheets include editable charts, peak attendance and progress against your guest-visit goal. Paste your counts into the yellow cells to update the dashboard.
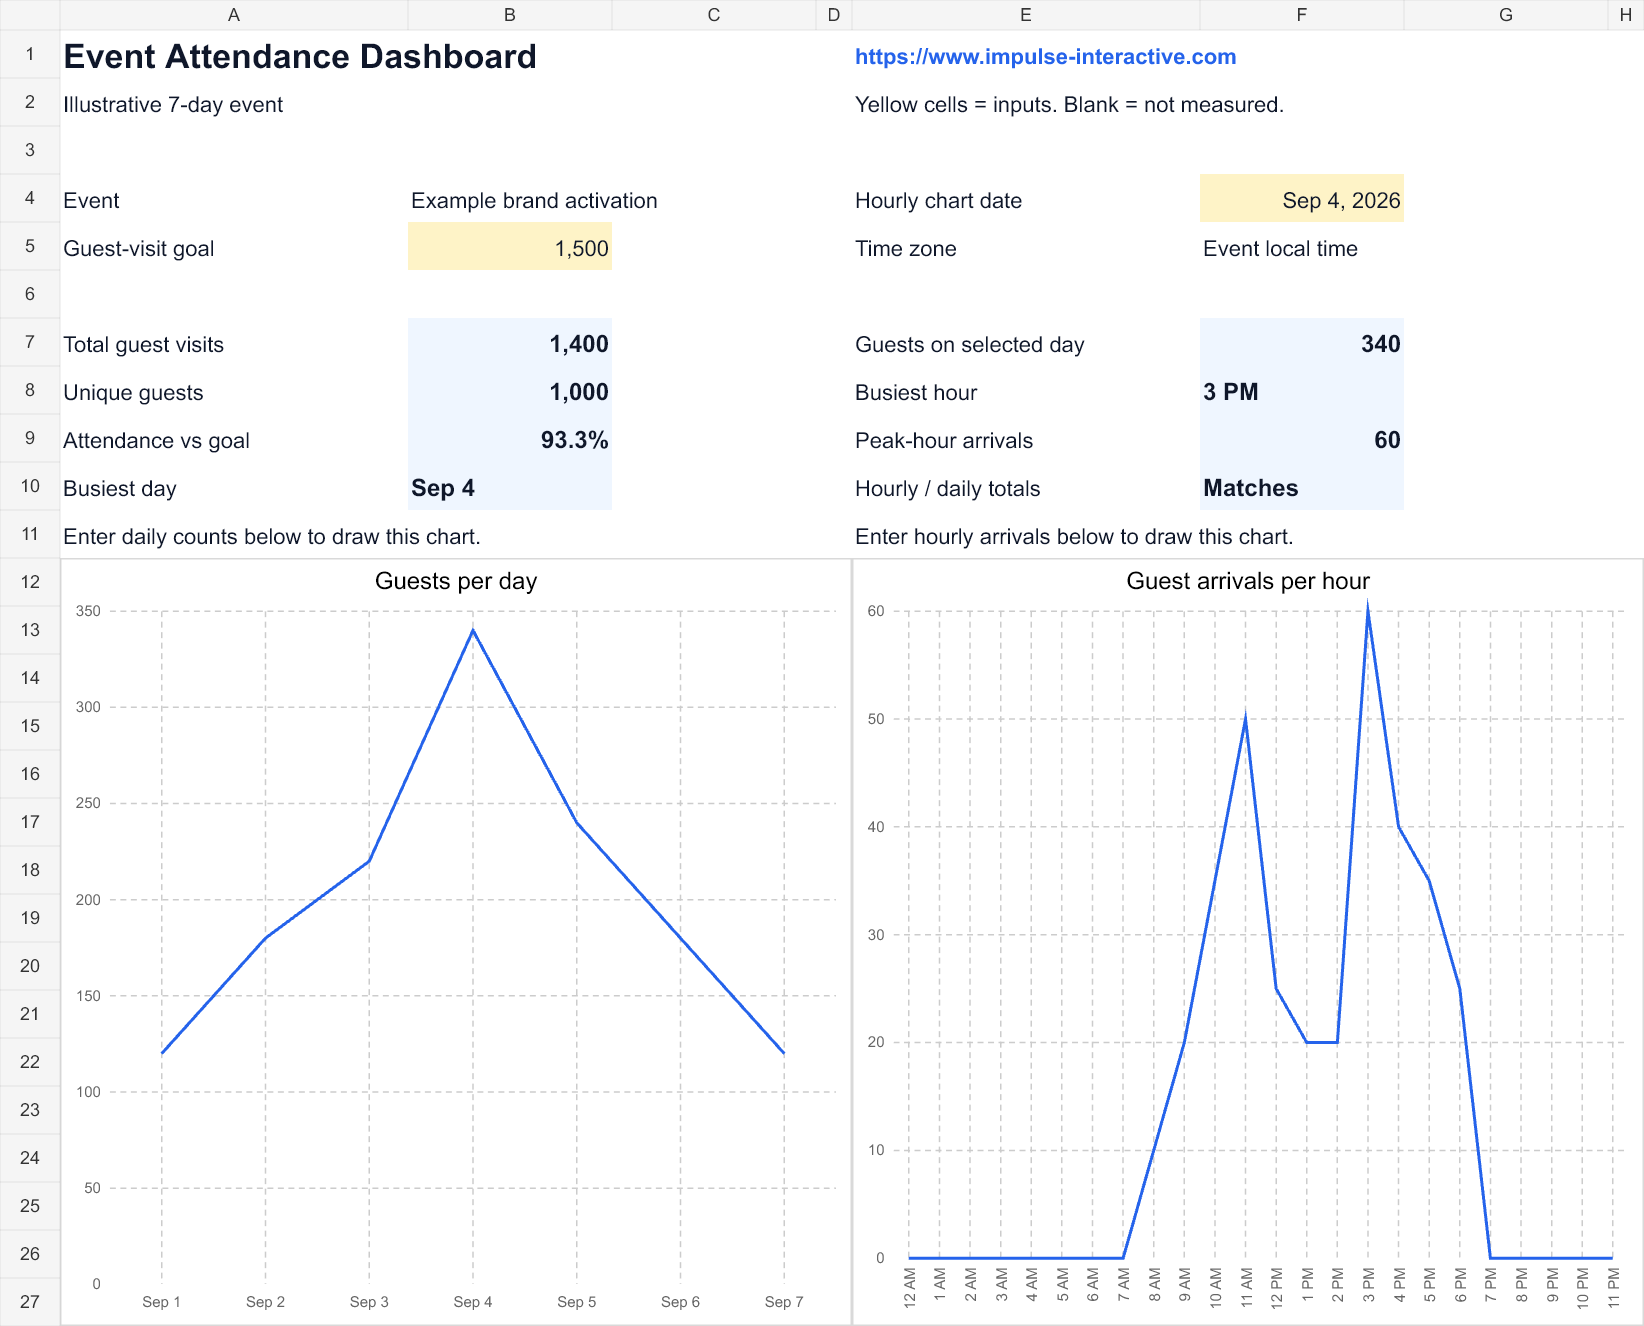
Illustrative 7-day event: 1,400 guest visits, 1,000 unique guests and 93.3% of the attendance goal.
Count each guest once per day. Keep unique guests separate, so someone returning on several days counts once in your total audience.
The hourly chart uses first arrivals for the date you enter. Add your counts for that day; changing the date alone does not load new data.
A Post-Event Report Example
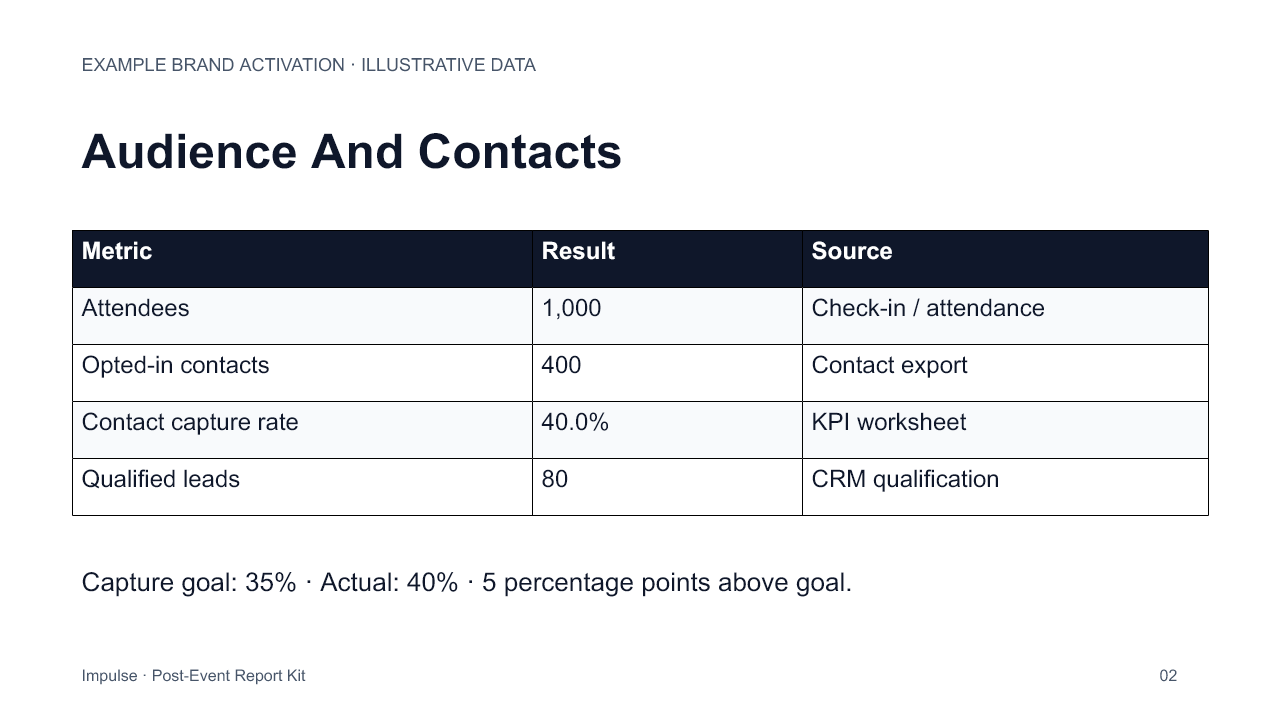
Here’s how one activation could read: 1,000 attendees, 400 opted-in contacts and 80 qualified leads. These sample numbers match the example deck and worksheet.
Audience and contact capture · Illustrative example
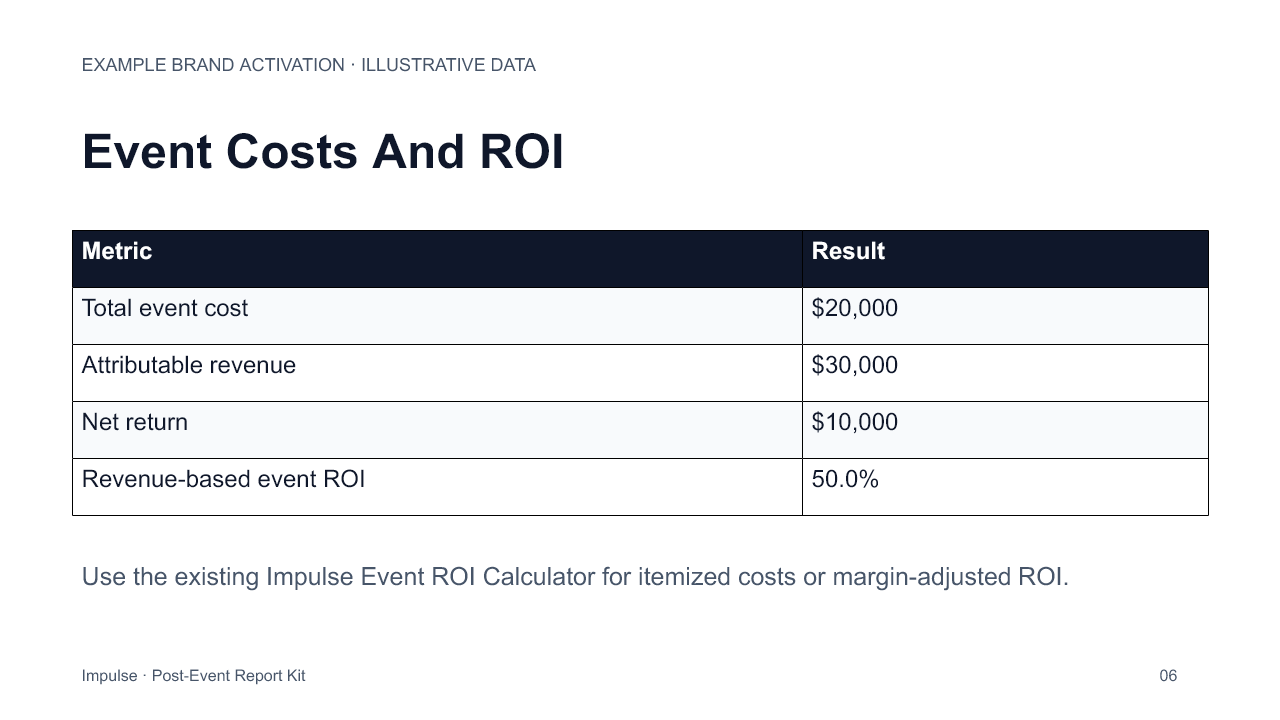
Costs and revenue · Illustrative example
Need to calculate the financial section? Use the event ROI calculator. To compare contact capture scenarios, try the event lead capture calculator.
Make The Template Yours
Download the kit, add your event details and fill in the yellow worksheet cells. Copy the calculated results into your slides, add photos and write your next steps.
The slides are editable and independent of the worksheet. Update their numbers when you update your report.
Make A Copy In Google Slides Or Sheets
Open a template below, sign in to Google and select Make a copy. Edit and share your own copy in Google Drive.
Enter event details and unique attendees in Your Event. Add daily counts and hourly arrivals in Attendance. Use the example tabs for reference.
IMPULSE ANALYTICS
Your Event Report, Already In Analytics
Impulse automatically creates your event report in Analytics. Spend less time assembling results and more time deciding what to do next.
Use your event performance report as the starting point. Add your own costs and sales revenue for the full financial recap.
See Impulse AnalyticsExplore event data capture with Impulse or see real event case studies.
Post-Event Reporting Questions
What Is A Post-Event Report?
A post-event report explains what an event achieved against its goals. It brings together attendance, engagement, feedback, follow-up results and costs, then recommends what to do next.
What Is Included In The Free Kit?
You get an editable PowerPoint template, a completed example, an Excel KPI worksheet and a setup guide. The presentation has seven report sections plus an Impulse Analytics resource slide. The worksheet includes daily and hourly attendance charts, a blank event tab and filled examples.
Can I Use Google Slides And Google Sheets?
Yes. Use the Google Slides and Google Sheets buttons to make your own copies. Sign in to Google, then select Make a copy. Edit and share the copies in your own Drive. Copy the calculated metrics into the slides when your report is ready.
How Do I Report Attendance For A Multi-Day Event?
Enter guests for each day in the Attendance tab. The dashboard charts daily attendance, identifies your busiest day and compares total guest visits with your goal. Use the hourly section for arrivals on one selected day. Count unique guests separately across the full event.
How Do I Calculate Event ROI?
Subtract total event costs from attributable revenue, then divide by total event costs. The worksheet calculates revenue-based ROI. Keep open pipeline separate from revenue, and use the same follow-up period throughout your report.
Does Impulse Create An Automatic Event Report?
Yes. Impulse automatically creates your event report in Analytics. Use it to review your event performance, then add your own costs and sales revenue when you need a complete financial recap.